
Introduction
Oil and gas wells are completed to establish a durable flow path between the reservoir and the surface, and one of the most persistent threats to that flow path is the reservoir itself. Unconsolidated or poorly cemented formations readily shed sand into the produced fluid stream, and this affects the large majority of producing wells worldwide (Kumar et al., 2024). The problem tends to worsen as reservoir pressure depletes, as water or gas breaks through, or simply as a well ages past the point where the rock matrix can support itself under drawdown. Once mobilized, sand particles erode chokes, valves, pumps, and surface piping, accumulate in the wellbore and reduce effective flow area, and in hydraulically fractured wells can flow back out of the fracture and strip away the conductivity the proppant was meant to provide. Left unmanaged, sand production shortens equipment life, forces expensive workovers, and in severe cases threatens wellbore integrity outright.
Operators have several sand control strategies available, including gravel packing, resin or chemical consolidation, and mechanical filtration, but sand screens have become the default choice in a large share of completions. They are comparatively simple to run, need little ongoing maintenance, and can be tailored to a wide range of formations and completion types (Kumar et al., 2024). A sand screen is essentially a downhole filter placed across the perforated or open-hole interval. It is engineered to admit oil, gas, and fine particles below a target size while blocking or bridging the coarser fraction of the formation sand at its surface, which builds a self-limiting sand bed that further restricts particle ingress over time. Several screen designs have evolved to suit different formations and production rates, among them slotted liners, wire-wrapped screens, pre-packed and gravel packed screens, woven or sintered mesh screens, and expandable sand screens. Each design trades off flow area, erosion resistance, plugging tendency, and cost differently, and each has to be sized against the particle size distribution of the formation sand to balance retention against productivity.
CFD has increasingly been applied to sand screen problems that are difficult or expensive to study experimentally at full scale, and the published work falls into two broad and active streams. The first is erosion prediction, where the concern is that fine particles passing through or partially plugging a wire-wrapped or mesh screen accelerate local flow through the remaining open area, wearing the slot edges and gradually enlarging the openings until retention is compromised. Studies in this stream have used Discrete Phase Model and Dense Discrete Phase Model approaches, coupled with empirical erosion correlations such as McLaury, Finnie, and Oka, to predict where and how quickly wear develops on wire wrapped, premium mesh, and star shaped screens as a function of particle size distribution, fines content, and flow velocity (Zhang et al., 2020; Abduljabbar et al., 2021). The second stream is focused on retention and filtration performance itself, using coupled CFD-DEM models to resolve how sand particles bridge, deposit, and eventually form a filter bed against the screen surface for a given slot or mesh geometry. Work by Mondal et al. (2011, 2012) and Wu and Choi (2016), among others, established this approach and used it to compare retention behavior across screen types such as wire wrapped, square mesh, and modified converging slot screens, and more recent studies have extended it to full slurry test comparisons and to the transition between initial bridging and long term filter bed control (Su et al., 2024).
Barracuda Virtual Reactor is well suited to this kind of problem for two reasons tied to how it resolves particle-laden flow. First, its Multiphase Particle in Cell (MPPIC) method tracks the local concentration, size distribution, and stress state of the particle phase directly. As particles accumulate at the screen, the particle stress model naturally resists further compaction and restricts additional particles from moving through, which reproduces the self-limiting behavior of a real screen without needing the screen geometry itself resolved down to the scale of its slot width. That matters because sand screen openings typically run from 100 to 250 microns, roughly four to five orders of magnitude smaller than the wellbore or fracture scale domains an engineer usually needs to simulate, which makes direct geometric resolution of the screen computationally impractical. Barracuda instead represents the screen as a baffle with a particle size-dependent passing probability, tuned to match a given screen’s retention behavior. Second, Barracuda’s GPU acceleration makes it practical to run these particle-resolved simulations at field-relevant scales and run times, rather than restricting the analysis to small coupon or lab-scale geometries, which extends the same modeling approach used for erosion and retention studies elsewhere in the literature to full-scale screen and completion geometries.
Model Definition
The model geometry used in this application is adapted from Wong et al. (2016). Figure 1 shows the domain (top panel), which includes the perforated base pipe, the baffle representing the sand screen and the shroud, and the wellbore, modeled at the outer diameter of the CAD geometry. The domain represents a section of wellbore with an outer diameter of 5.5 inches. The sand screen itself is not resolved as solid geometry; instead, it is defined as a baffle in Barracuda, positioned along a screen length of 550 mm (21.65 inches) and with a diameter of approximately 5.26 inches. A water and sand slurry is injected radially into the domain, as shown in Figure 1 (bottom panel), representing flow moving in from the formation toward the wellbore. A pressure outlet is defined at the base pipe end of the domain, allowing both liquid and particles that pass through the baffle to leave the system.
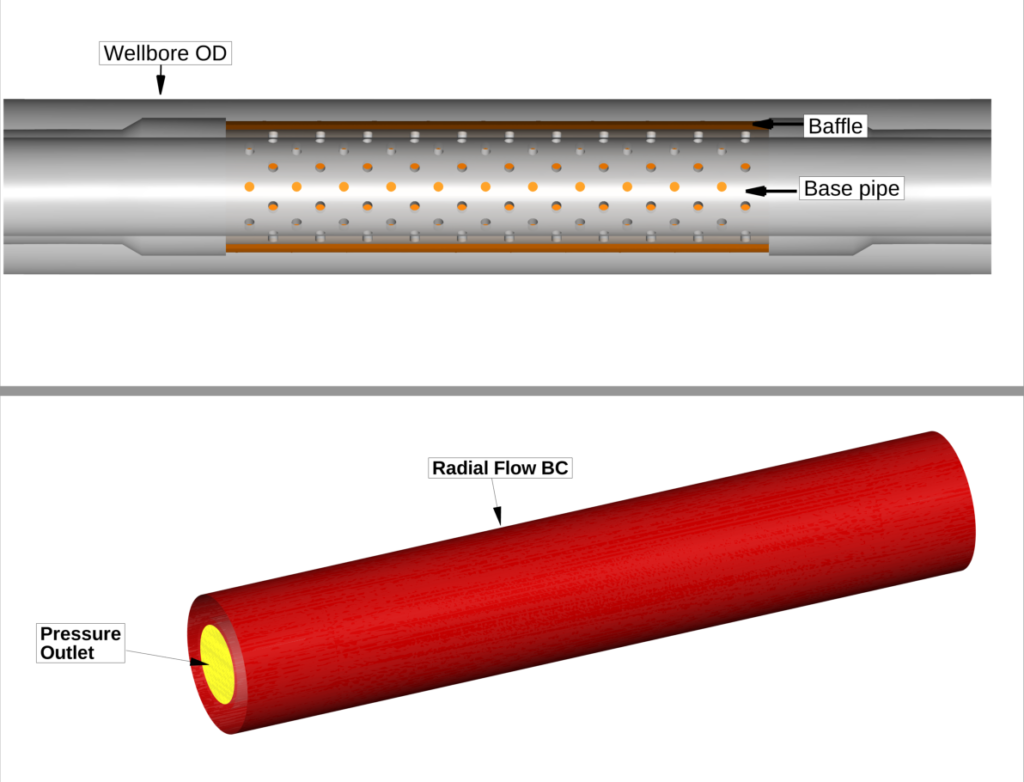
Figure 1: Cross section of the CFD domain showing wellbore OD, baffle representing the sand screen, and base pipe (Top); Radial flow inlet for sand and water representing flow moving in from the formation toward the wellbore and pressure outlet (Bottom).
The particle size distribution (PSD) of the formation sand is defined under the Particle Species setup in Barracuda, where a user can directly input a size distribution as a table of particle diameters and their corresponding cumulative mass fraction percentage. Because Barracuda uses the MPPIC method, particles are represented as computational parcels that carry their own size as an attribute, so a full PSD can be injected as a single particle species rather than requiring a separate simulation for each size class. For this simulation, the formation sand PSD (shown in Figure 2) was taken from Mondal et al. (2012) and used directly as the input distribution for the injected particle species.
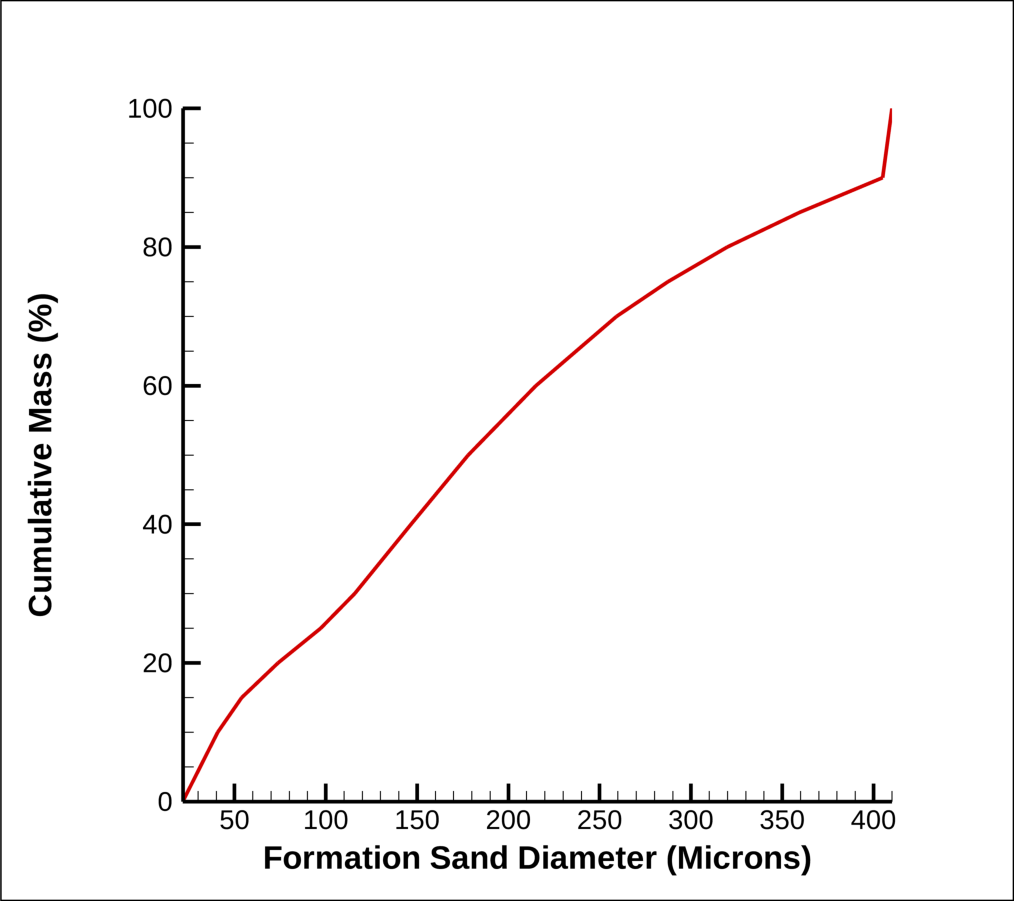
Figure 2: Formation Sand PSD.
Results and Discussion
Figure 3 shows the pass-through probability assigned to the baffle as a function of particle diameter. Particles up to 100 microns pass through with a probability of 0.25, reflecting the openings expected for a screen of this rating. Between roughly 100 and 150 microns, the probability drops sharply, falling from 0.25 to 0.01 over that narrow size range, which represents the screen’s cut point where the openings begin to effectively block particles from passing. Beyond 150 microns, the pass-through probability stays flat at 0.01 out to the largest particle size considered, 410 microns, meaning only a small fraction of the coarsest formation sand is expected to make it through the screen. In this setup, the positive and negative pass-through probabilities were defined identically, so the baffle filters particles the same way regardless of which direction they approach it from. The section below on Baffle as a Sand Screen contains more details about the baffle creation, its properties, and pass-through probability definition.
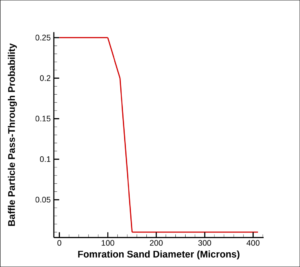
Figure 3: Baffle particle pass-through probability as a function of particle diameter.
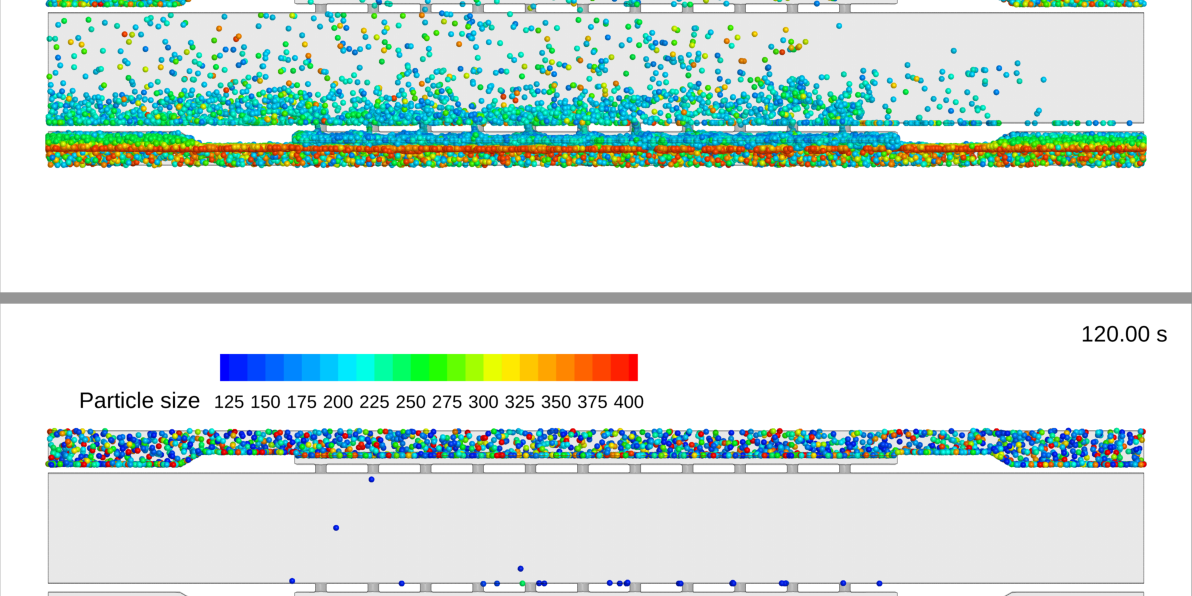
Figure 4 shows an animation of formation sand particles moving through the domain, viewed on a cross section of the sand screen tool. To make the size-dependent filtering behavior easier to see, the animation is split into two panels, with value blanking applied in each to hide particles outside the size range of interest. The top panel blanks particles above 125 microns, showing only particles between 0 and 125 microns, and the bottom panel blanks particles below 125 microns, showing only particles between 125 and 400 microns. Particles are colored by size in both panels. Sand and water enter radially from the top and bottom of the domain, and the baffle representing the sand screen sits in the middle of the wellbore section.
In the top panel, a substantial number of smaller particles, mostly in the blue to green range below roughly 100 microns, have crossed the baffle and passed through the perforations into the base pipe, where they appear scattered throughout the interior, consistent with the higher pass-through probability assigned to that size range. In the bottom panel, by contrast, only a handful of particles are visible inside the base pipe, and nearly all of them are the smallest sizes shown on that panel’s scale (dark blue, close to 125 microns). Particles above roughly 150 microns are effectively absent from the base pipe interior in both panels, remaining concentrated in the annular region outside the baffle where they accumulate over time. This size-dependent separation across the baffle is a direct reflection of the pass-through probability curve discussed earlier: particles below the screen’s effective cut point pass through readily, while coarser particles are retained at the screen surface.
Figure 4: Animation of formation sand particles split by size range (0–125 microns and 125–400 microns), showing size-dependent filtering across the sand screen baffle over time
Figure 5 and Figure 6 show the cumulative particle mass by size at the inlet and outlet of the domain, respectively, capturing how the sand screen performs across the full formation sand PSD over the course of the simulation. The inlet distribution (Figure 5) spans the full injected range, from the smallest particles up to 400 microns, with the largest mass fraction concentrated in the finest size bins and a broad, fairly even spread of mass through the mid and coarse range, reflecting the formation sand PSD used as the injection input. The outlet distribution (Figure 6) tells a very different story: essentially all of the particle mass that exits the domain is confined to sizes below roughly 150 microns, with the outlet mass dropping off sharply above about 50 microns and falling to effectively zero beyond 140 microns. Notably, the outlet mass scale is an order of magnitude smaller than the inlet scale, underscoring how much of the total sand mass is retained at the screen rather than produced through it.
This kind of inlet-outlet comparison gives a direct, quantitative picture of screen performance across a realistic, polydisperse formation sand, rather than a single particle size in isolation. This is close to the kind of comparison an engineer would use in practice. Kumar et al. (2024) note that particle size distribution is one of the central inputs to sand screen design, since a formation with a narrow PSD can often be controlled with a single screen while a broader distribution may require multiple screens or a different retention strategy altogether, and comparable inlet-outlet mass or retention curves are exactly what laboratory sand retention testing is used to generate for a candidate screen. Being able to generate this same kind of inlet-outlet PSD comparison directly from a full transient simulation, for a specific well geometry and a specific formation PSD, rather than only from a coupon-scale lab test, means a screen’s expected performance can be evaluated ahead of time and tied back to the actual completion design, informing decisions such as screen slot size, mesh rating, or whether a given formation’s PSD calls for a different sand control approach altogether before it is ever run downhole. Barracuda tracks each particle’s size directly as it moves through the domain, so this kind of size-resolved comparison between what enters and what actually passes through the screen is a natural output of the simulation, and can be regenerated for different formation PSDs or screen ratings without changing the underlying model.
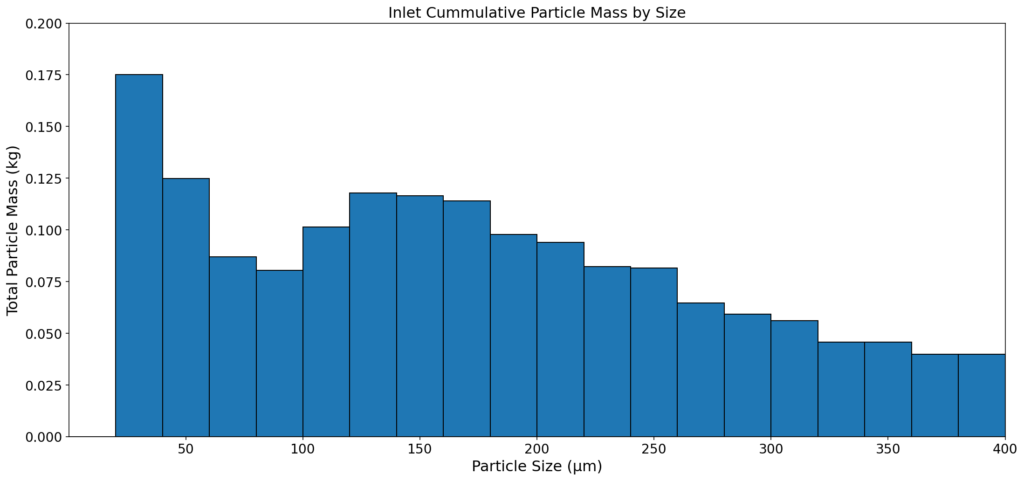
Figure 5: Cumulative inlet particle mass by size, representing the injected formation sand PSD.
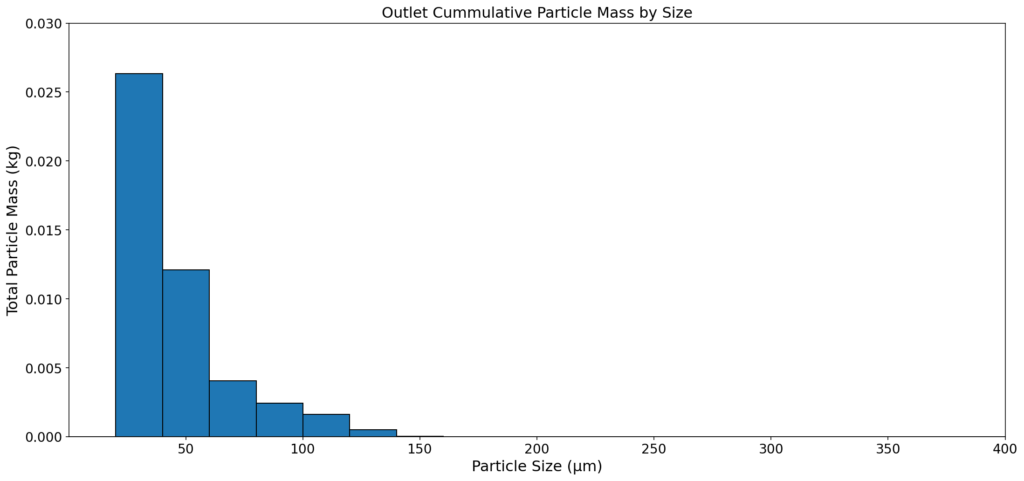
Figure 6: Cumulative outlet particle mass by size, showing the size distribution of sand passing through the sand screen baffle
Modeling Instructions
Filtration Performance of Sand Screens in Oil & Gas Wells Barracuda CFD Simulation Setup
The user is expected to have already gone through basic Barracuda training, Barracuda Virtual Reactor New User Training | CPFD Software (cpfd-software.com).
- Download the support files provided along with this post.
- Unzip the support file and place it in the working directory set up for this Sand Screen Filtration Performance project.
- Open a new Barracuda session.
- From the File menu, choose Open Project. Navigate to the working directory and select sand_screen_filtration.prj.
The project file has already been set up with the appropriate
- Grid.
- Baffle Definition and passing probability
- Base Materials.
- Initial Conditions
- Fluid ICs.
- Particle Species.
- Boundary Conditions
- Pressure BCs.
- Flow BCs.
Some of the key highlights of the simulation setup are described in more detail below
Baffle as a Sand Screen
In this model, the sand screen is represented in Barracuda as a baffle positioned across the flow path, so that fluid and particles moving through the wellbore annulus must pass through it to reach the outlet. Rather than resolving the physical slots or pores of the screen, which would require an impractically fine grid given how small they are relative to the wellbore, the baffle is assigned a particle-passing probability that governs the likelihood of a particle crossing it as a function of particle size. The same baffle setup can be used to represent wire-wrapped screens, woven metal mesh, slotted liner, etc., since it is ultimately the passing probability curve, not the specific screen geometry, that determines filtration behavior in the model. That curve can be tuned directly against sand retention test data for a given screen, such as the results reported by Mondal et al. (2011, 2012), so that the passing probability used in the simulation reflects the actual filtration behavior measured in the lab rather than an idealized cutoff. Because the passing probability is defined per particle size, different screen sizes and mesh ratings can each be represented with their own distinct curve, allowing the same baffle framework to be reused across screen selection studies without changing the underlying model setup.
Baffle Creation, Properties and Pass-through Probability
Using a baffle as a sand screen involves three steps: creating a cylindrical baffle, defining its properties, and then defining the particle pass-through probability to filter particles based on their size.
- Baffles in Barracuda are defined under Setup Grid, Baffles tab. In the provided support file, a cylindrical baffle representing the sand screen has been created. Users can check out the following link on the CPFD software website to learn more about creating baffles in Barracuda: https://cpfd-software.com/using-baffles-to-model-structured-packing/.
- The next step is to define the properties of the baffle. This is done by clicking the Edit button under Properties, which opens the Baffle Properties dialog window. A K-factor is defined in the x, y, and z directions, simulating the resistance the baffle offers to fluid flow and the resulting pressure drop as fluid passes through it. The Directional Particle Filtering option is toggled on to allow a user-specified portion of particles to pass through the baffle based on each particle’s velocity direction. Values are assigned to Nx, Ny, and Nz to define the positive direction for the filter; this vector, together with the particle’s velocity vector as it crosses the baffle, determines whether the positive or negative pass-through probability applies. Figure 7 shows a screenshot of the Baffle Properties Window with the K-factor and Directional Particle Filtering values used in the current setup.
- The pass-through probability as a function of particle size is defined through an SFF file by toggling the File option and clicking Edit, which opens the Baffle Particle Filter Editor window. Here, a pass-through probability is assigned to each particle size, describing how likely a particle of that size is to pass through the baffle, depending on its direction relative to the positive direction vector defined under Directional Particle Filtering. Figure 8 shows a screenshot of the Baffle Particle Filter Editor window and the probability values used for this setup. Users can tune these probability values to match the filtration behavior of their specific sand screen being modeled.
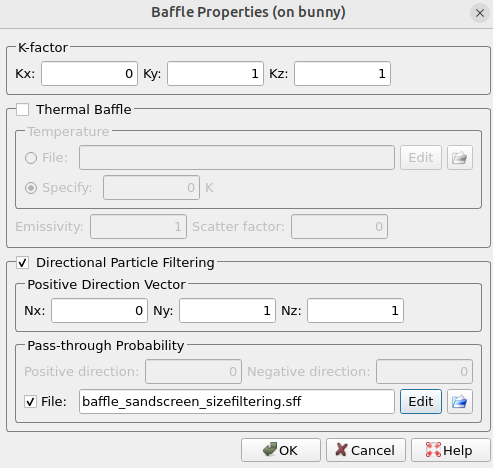
Figure 7: Baffle Properties window showing the K-factor and Directional Particle Filtering settings used in the current simulation setup.
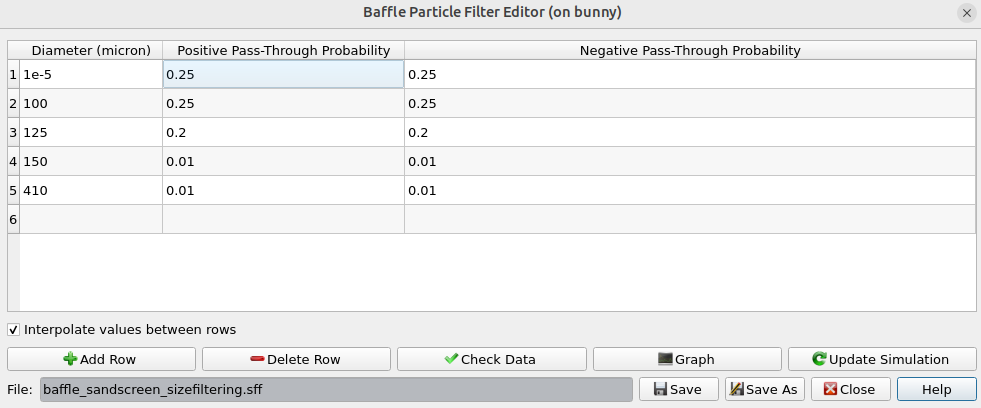
Figure 8: Baffle Particle Filter Editor window showing the pass-through probability values assigned by particle diameter.
Time Controls
- Enter 0.0075 secs for Time Step and 120 secs for End Time.
- Enter 10 secs for the Restart Interval.
Visualization Data
- Enter 0.05 secs for the Output file interval.
- Select the Visualization Data for post-processing as shown in Figure 9.
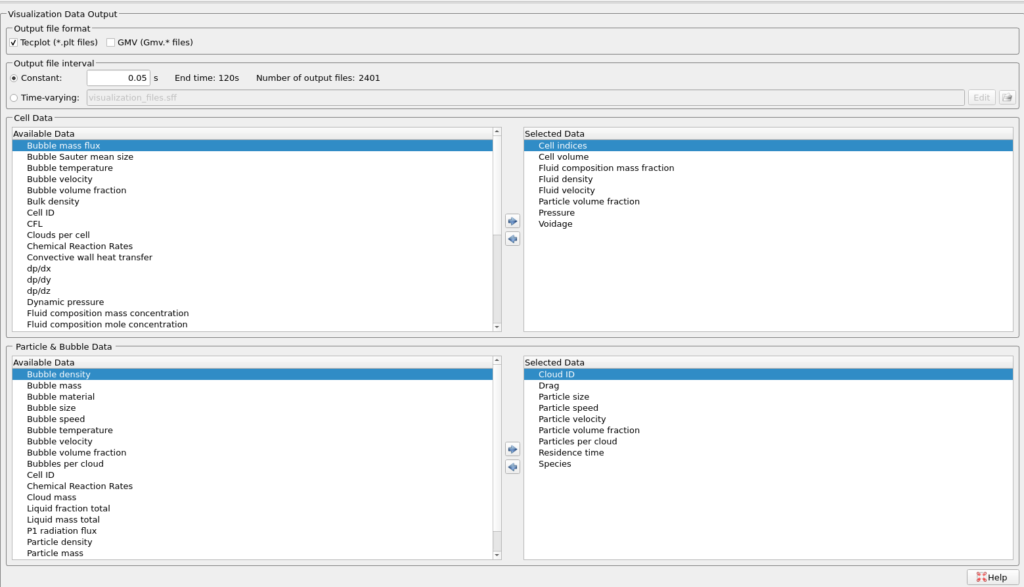
Figure 9: Visualization data selected for post-processing.
Run
- Click on Run and then click on Run Solver.
- Select GPU Parallel if you have the required GPU parallel license.
Post-Processing in Tecplot
The user is assumed to have gone through basic Tecplot training, Getting Started With Tecplot For Barracuda® | CPFD Software (cpfd-software.com). Only a few brief steps for post-processing the results are explained.
To reproduce the animation shown in Figure 4, use the layout file fig4.lay provided in the zipped support file. To load the layout file into Tecplot from the Barracuda GUI:
- Navigate down to Post-Run in the project tree and select either View Results or Launch Tecplot tab.
- In the newly opened Tecplot window, select File –> Load Barracuda Data –> Load Layout, navigate to the directory where the support file was unzipped and saved, and select fig4.lay and click Open. This should then reproduce the view shown in the figure for top and bottom panel animations.
This concludes the description of the Application Model: Filtration Performance of Sand Screens in Oil & Gas Wells.
References
Kumar, S., Kumar, G., Krishna, S., Kumar, A., Gupta, T., Goel, P. N., & Kumari, S. (2024). Sand screens for controlling sand production from hydrocarbon wells: A mini-review. Geoenergy Science and Engineering, 240, 213040.
Zhang, R., Hao, S., Zhang, C., Meng, W., Zhang, G., Liu, Z., … & Tang, Y. (2020). Analysis and simulation of erosion of sand control screens in deep water gas well and its practical application. Journal of Petroleum Science and Engineering, 189, 106997.
Abduljabbar, A., Mohyaldinn, M., Younis, O., & Alghurabi, A. (2021). A numerical CFD investigation of sand screen erosion in gas wells: Effect of fine content and particle size distribution. Journal of Natural Gas Science and Engineering, 95, 104228.
Mondal, S., Sharma, M. M., Chanpura, R. A., Parlar, M., & Ayoub, J. A. (2011). Numerical simulations of sand-screen performance in standalone applications. SPE Drilling & Completion, 26(04), 472-483.
Mondal, S., M Sharma, M., M Hodge, R., A Chanpura, R., Parlar, M., & A Ayoub, J. (2012). A new method for the design and selection of premium/woven sand screens. SPE Drilling & Completion, 27(03), 407-416.
Su, N. C., Jusof, S. A. I., Zainal, A. Z., Jian, Y. Y., Xian, C. K., Laziz, A. M., … & Maoinser, M. A. (2025). Enhancing sand screen performance with integrated slurry testing and CFD-DEM modelling. Heliyon, 11(1).
Wu, B., Choi, S. K., Feng, Y., Denke, R., Barton, T., Wong, C., … & Zamberi, M. (2016). Evaluating sand screen performance using improved sand retention test and numerical modelling. Offshore Technology Conference Asia.
Wong, C. Y., Wu, B., Solnordal, C. B., Yang, W., Zamberi, M. S. A., Shaffee, S. N. A., … & Jadid, M. (2016, March). The Flow-Field and Sand Retention Characteristics of a Full-Scale Sand Screen for Gas Field Deployment. In Offshore Technology Conference Asia (p. D042S006R018). OTC.