
Introduction
Developed in the mid-20th century, FCC units are the beating heart of modern oil refineries, providing value through their exceptional ability to convert low-value feedstock into valuable and highly demanded products. Development of the fluid catalytic cracking (FCC) process began in the 1930s, with critical advances in heterogeneous catalysis leading to the eventual deployment of operational units spurred by wartime demand during the Second World War. The need for this unit arises from the fact that higher-value products like diesel, gasoline, propylene, and ethylene exist in low quantities in readily available forms. Most crude oil consists of heavier fractions with limited use, but they can be broken down into lighter molecules through a process known as catalytic cracking. Highly porous zeolite catalysts used in the FCC process enable energy-efficient cracking and ultimately lead to the production of up to 45% of a refinery’s gasoline production (Meirer et al., 2015).
The FCC process operates as a continuous, low-residence-time loop connecting a riser reactor, a fractionator, and a regenerator. Pre-heated liquid hydrocarbon feed is atomized with steam and injected into the bottom of the riser reactor, where it instantly contacts a stream of hot, fluidized catalyst particles flowing from the regenerator. The intense heat from the catalyst (typically 650–700°C) rapidly vaporizes the atomized liquid droplets, initiating endothermic cracking reactions as the vapor-catalyst mixture accelerates up the riser in a turbulent, multiphase flow. The heavy molecules are cracked into lighter vapors, which are then separated from the coked catalyst via cyclones at the top of the reactor and sent to the fractionator column to be distilled into distinct products like gasoline and diesel. Meanwhile, the spent, coke-covered catalyst flows downward into the regenerator, where air is injected to burn off the carbon, a highly exothermic process that reheats and restores the catalyst before it is looped back to the base of the riser to vaporize the next incoming batch of feed. In this specific FCC riser, based on the findings of Berrouk et al. (2017), the feed is staged over several injection locations at different elevations to create reaction zones where certain reactions are favored over others. The lowest feed zone involves lighter hydrocarbon cuts that require high catalyst-to-gas oil ratios, increased reaction temperatures, and low residence times. To prevent over-cracking of the light species, a second mixed temperature control (MTC) injection zone exists, where heavier gas oil cuts are fed. These species react preferentially with the cooled catalyst because they have higher absorptivity than lighter cracked gases, stopping most light gases from cracking further. Finally, a third slurry oil injection is fed near the riser outlet to terminate all cracking reactions before the gas is separated and routed downstream. In reality, FCC feed is not made up of a single compound; it is a multi-component mixture made up of numerous species cuts with a wide boiling point range. When the feed is introduced to the riser as droplets, the high temperature of the pre-lifting steam and catalyst causes the droplets to evaporate and transfer into the gas phase.
Evaporation in this zone is driven by intense conductive and convective heat transfer from the steam and hot catalyst particles colliding with the droplets, and due to the wide boiling point distribution of the feed, not all species will evaporate at the same rate. Ensuring that the feed vaporizes completely is a major concern and paramount to good unit operation for several reasons.If the atomized feed droplets fail to vaporize quickly and completely in the riser, it triggers a chain reaction of operational and economic problems. Fast, uniform vaporization is required because catalytic cracking occurs only in the vapor phase when hydrocarbon gas can permeate the microscopic pores of the zeolite catalyst. Unvaporized liquid droplets will physically coat the hot catalyst particles, blocking the catalyst’s active pore sites and halting the catalytic reaction. Instead of cracking cleanly, the liquid on the hot zeolite catalyst essentially bakes itself into a thick layer of solid carbon known as coke. All carbon-based catalytic reactions form coke, but with unvaporized feed, the rate of coke formation would be much higher than in normal operations and would massively impede the unit’s production and operational capability. The excess coke eventually travels to the regenerator, where it must be burned off. Burning excess coke generates far more heat than the system is designed to handle, which throws off the unit’s heat balance and forces operators to reduce the feed rate to the riser, while also compromising the unit’s metallurgical structural integrity. Additional coke-related issues result from non-catalytic or thermal cracking of gas oil. If vaporization is too slow, the droplets absorb heat without actually coming into contact with the catalyst’s active sites. The gas oil undergoes thermal cracking due to extreme heat instead of the favored catalytic cracking. Thermal cracking produces high amounts of low-value “dry gas” (methane and ethane) and solid coke, rather than the high-value gasoline and olefins that the refinery desires to produce. The heavy, unvaporized liquid droplets also have high momentum. If they aren’t vaporized quickly, they can crash into the riser walls and stick to the refractory. Over time, the liquid bakes onto the walls, creating coke buildups that reduce the riser diameter and alter local and overall riser hydrodynamics, also causing thermal stress and erosion that permanently damages the riser. The FCC injection zone is an incredibly chaotic environment characterized by a complex vapor-liquid-solid flow.
The complexity of species interactions and the conditions under which they meet make physical experimentation alone incapable of providing a clear window into the rapid interactions occurring inside, and advanced simulation software like Barracuda Virtual Reactor becomes incredibly valuable. Unlike standard CFD approaches that struggle with the computational load of billions of particles, Barracuda utilizes the Multi-Phase Particle-in-Cell (MP-PIC) framework, which is specifically designed to handle large, industrial-scale particulate loadings and couple them with thermal and chemical reactions. Studying and optimizing the feed of FCC gas oil to the riser is a task Barracuda is uniquely well suited to. Users can accurately simulate the complex heat, mass, and momentum transfer between catalyst, steam, and evaporating oil droplets. By uncovering these interactions virtually, engineers can optimize vaporization and boost unit efficiency without relying on expensive physical testing. FCC feed oil is a complex mixture of thousands of hydrocarbon molecules, meaning that it has a True Boiling Point (TBP) curve, not a single boiling temperature. The feed boils over a wide temperature range, typically from about 50 to 500 °C. To simulate the range of species volatility, liquid droplets in Barracuda can contain several species, each representing a different cut with its own unique boiling-point range. To enhance the accuracy of the simulation, this model is supported by a newly developed in-house API correlation-based feed-specification Python script that takes boiling-point-range data and Watson K factors as inputs and provides a full suite of temperature-dependent material properties. This application model post explores setting up an industrial-scale FCC riser simulation using the feed specification tool and analyzes feed vaporization across the riser geometry.
Model Definition
The application model uses a compressible domain of 70,000 cells, with interphase momentum transfer calculated by the WenYu-Ergun drag model. The computational domain, including the physical riser geometry, nozzle placement, and boundary conditions, is based on an existing 6000 kton/year riser, which is outlined in Berrouk 2017 [1]. Figure 1 identifies the riser geometry and all included boundary locations. The riser expands to three separate diameters, as it was found to increase reactant contact time and catalyst efficiency at the bottom of the unit. While exact riser dimensions are proprietary, the largest diameter is over 2.5 meters (m), and the physical nozzles are 0.1 m in diameter. Three injection locations are present in the riser, a light gas (LG) feed at 7.5 m in elevation, the MTC feed at 11.25 m, and finally the slurry oil feed at 19.25 m. The LG feed is a mixture of gasoline saturates (30.43 wt%), aromatics (1.31 wt%), and olefins (68.26 wt%), injected as liquid droplets at 189.93 kg/s. Atomizing steam is also fed with the LG at 15.13 kg/s. Several meters above the LG oil injection point, the MTC oil injection feeds heavy oil (HO), which prevents overcracking of light gases; it is fed at 19 kg/s, with atomizing steam at 1.31 kg/s. The HO is fed at a cooler temperature of 422.15 K to further slow the reactions. The HO receives the most headroom to ensure complete evaporation, and all cracking reactions are finally quenched using slurry oil injections. From the slurry injection point, HO is fed at 0.69 kg/s with a steam flow of 0.042 kg/s.
The boiling point ranges for the fed species are taken from Gann et al. (2011) and used in place of a single lumped species in the work of Berrouk et al. (2017) to attain a higher-resolution model for liquid droplet evaporation. The droplet sizes range from 50- 500 microns and follow a normal distribution, while the catalyst particles are a typical Group A FCC catalyst. The model also includes two flow BCs: prelifting steam fed from the bottom of the riser at 0.82 kg/s and 633 K, and a catalyst feed inlet supplying freshly regenerated catalyst at 1740 kg/s and 973 K, with an additional 0.75 kg/s of steam. The riser outlet is modeled with a pressure BC set to 1.66 bar and 873 K. The system is thermal, with a custom convective heat transfer coefficient specified to account for the more dilute, transport-like conveying of solids in the riser, so heat transfer behaves more as though a single particle were surrounded by fluid.
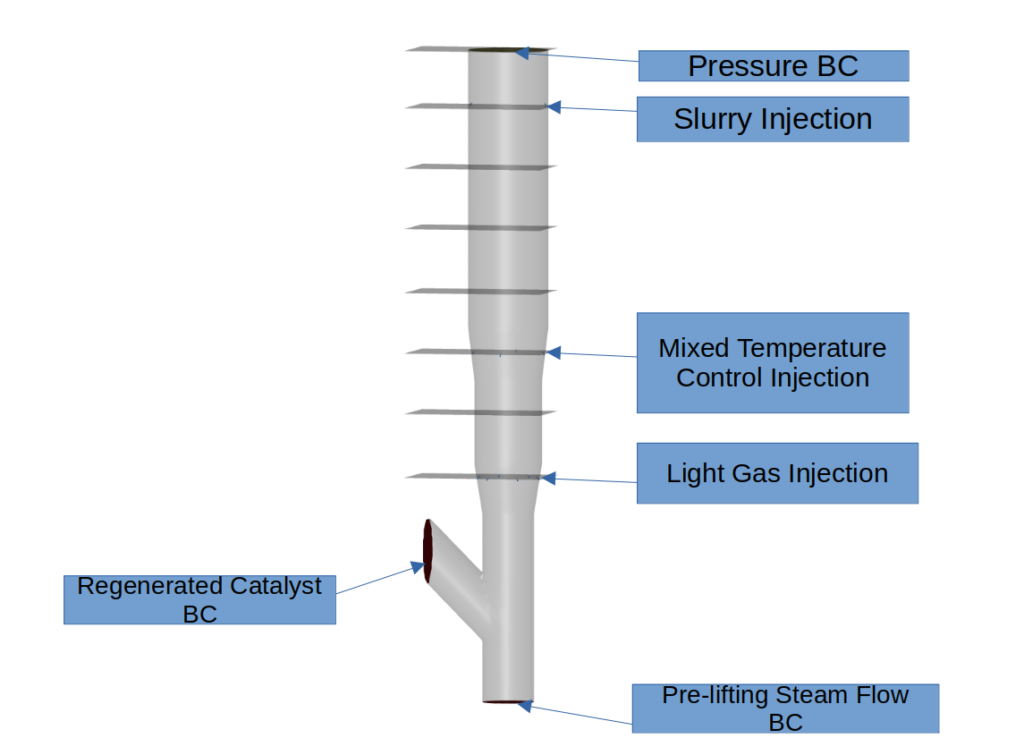
Figure 1: FCC Riser Geometry, Boundary Conditions, and Flux Planes.
Feed Specification Tool
To help specify FCC feed oil cuts as base materials in Barracuda, a Python script was developed based on API correlations, using boiling point distribution as input and returning temperature-varying material properties for the gas and liquid phases of each feed cut. This script is included in the downloadable support file in the Modeling Instructions section of the post. The calculation starts with a true boiling point (TBP) distillation curve, a standard experimental way to characterize the composition of crude oil and petroleum fractions. If the feed characterization instead uses an ASTM D86 distillation, the script includes a procedure to convert the data to TBP format. Either way, each plot provides a continuous mapping of volume percent recovered vs boiling temperature. The TBP curve is simply an experimental record of a large mixture’s boiling point behavior, and this can be discretized into a pseudocomponent scheme where several individual species are defined with well-defined vapor pressures that Raoult’s law can then operate on. For each desired lump, users can choose a lower and upper boiling point range, which is more of a modeling decision than something the data provides automatically. Wider cuts make postprocessing easier and can reduce computational overhead, while narrower cuts can increase simulation resolution, at the risk of becoming too narrow and defining several species that may be more or less identical.
For each boiling point range, the script calculates the midpoint boiling point Tb. Boiling point alone is not necessarily enough to differentiate between similar species. For example, heptane and toluene boil at similar temperatures, but have different material properties. An additional piece of necessary information is the specific gravity (SG) of the cut, which can be calculated using the Watson K factor. Once each defined lump has been assigned a Tb and an SG, the script runs a series of correlations from the API Technical Data Book. The first calculation in the downstream portion of the script is molecular weight since several later correlations depend on this. Critical temperature (Tc), critical pressure (Pc), critical volume (Vc), and the acentric factor of each cut are calculated next. With these five values, the vapor pressure within the specified temperature range is estimated using a Lee-Kesler-style correlation. What follows are calculations of density, viscosity, thermal conductivity, heat capacity, heat of vaporization, enthalpy, and heat of formation. If data from the feed composition curve (true boiling point/volume % data) is provided, the script performs volumetric integration, interpolating the feed curve to find what volume fraction of the entire feed falls within the specified lump window, and normalizes the sum of all lumps to 1. The volume percents are then converted to mass fractions using the estimated SG values, and an overall feed composition is output in a .csv file. Additionally, .sff files are created for each material property and automatically added to a project file that can serve as a starting point for the model. To access the feed specification script, download the support file provided in the modeling instructions section further below.
Results and Discussion
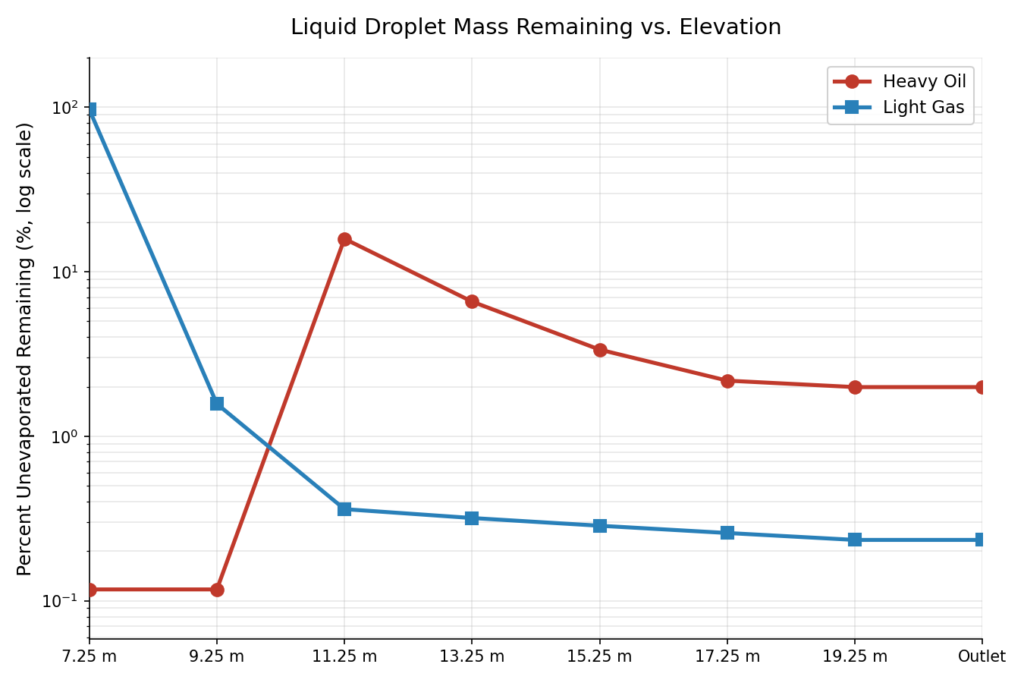
Figure 2: Percent Evaporated vs. Elevation
At the outlet of the FCC riser, 98.01% of the heavy oil (HO) and 99.77% of the light gas (LG) have evaporated into the gas phase. To better characterize the vaporization kinetics of each species, multiple flux planes (see Figure 1) were established between the 7.25 m elevation and the riser outlet. As shown in Figure 2, the remaining unevaporated liquid mass for both species is plotted against elevation to highlight these phase transitions. The light gas (blue trendline) is introduced at 7.25 m in elevation and exhibits an initial period of rapid vaporization over 4 m. By the time the LG reaches 11.25 m, the MTC injection location, the unevaporated light gas mass fraction has diminished to less than 0.4%, ultimately tapering to 0.23% at the riser outlet. Conversely, heavy oil (red trendline) is injected at an elevation of 11.25 m. Following a sharper initial drop, the HO evaporates more gradually over the remaining 8 meters of the riser. The vaporization rate progressively slows at higher elevations, ultimately leaving about 2% of the heavy oil as liquid droplets at the exit. Overall, these profiles show that while both hydrocarbon feeds achieve near-complete vaporization, the LG volatilizes substantially faster upon injection than the HO fractions.
Figure 3: Particle Size Change of LG and HO.
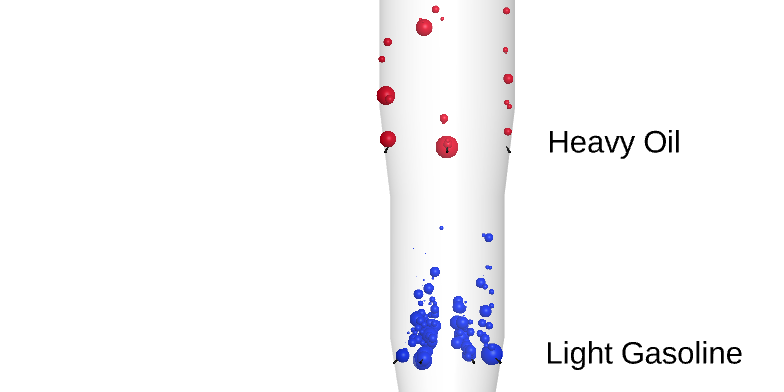
To visualize the evaporation of fed liquid droplets, Figure 3 provides an animation of the LG species and HO species from 10 to 80 seconds. The particle sizes appearing in the animation are scaled to the actual droplet size, and particles that reach a low cutoff size are blanked by the solver and assumed to be completely evaporated. In the leftmost panel, LG is fed from the feed oil injections at 7.25 m, and the droplets quickly evaporate over the next 3-4 meters, closely agreeing with the flux plane data in Figure 2. By the time the fluid/catalyst mixture reaches the second injection location at 11.25 m, no visible LG droplets remain, indicating that the droplets are so small that the liquid mass is negligible. The HO droplet feed animation on the right shows the droplets lingering longer before evaporating, and they also tend to travel along the riser walls instead of dispersing across the entire riser cross section. The slow evaporation agrees with the conclusions presented in Figure 2, with particles evaporating completely only 1-2 m from the outlet. The 2% unevaporated HO species can be attributed to the slurry oil feed roughly 1.5 m from the outlet, which serves as a cracking-reaction terminator that does not fully evaporate.
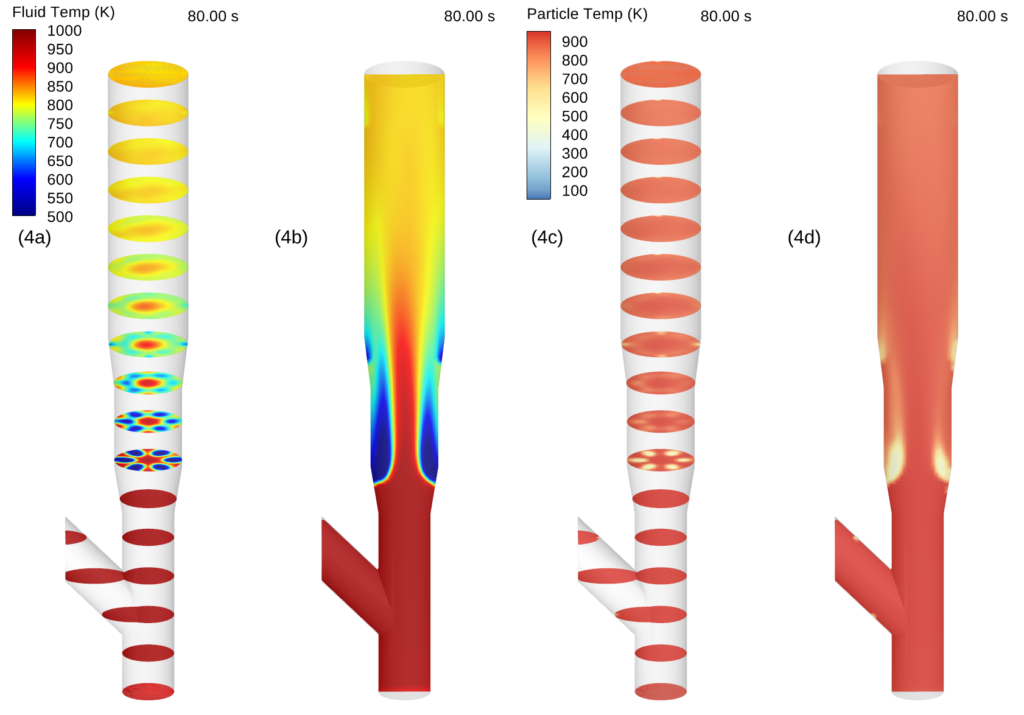
Figure 4a/b: Time Averaged Fluid Temperature (K), 4c/d: Time-Averaged Particle Temperature (K)
In order for the feeds to vaporize, the temperatures in the riser must lie within the boiling point range of the liquids. The LG species boils from 38 – 204 °C, while HO boils in a much higher range from 350 – 500 °C. Figure 4 shows the particle and fluid temperature distributions throughout the riser at varying elevations (a,c) and across the vertical cross section of the riser (b, d). For all panels, the fluid and particle temperatures are consistent up to the first injection location, as the bottom 7.25 m is well mixed with hot catalyst, which transfers heat to the pre-lift steam and equilibrates to around 700 °C. However, temperature drops drastically as LG is fed to the riser. In Figure 4a, at the 7.25 m injection location, 6 cold spots appear, corresponding to the six LG injection locations. Temperature from the hot gas and catalyst is utilized as heat of vaporization for the liquid droplets, cooling the liquid greatly as the droplets evaporate over the next 3-4 m. In 4b, the riser temperature rises slightly back to 500 °C just after the LG species is fully evaporated, and the blue trail on the contour plot closely resembles the LG droplet feed profile in Figure 6. Just above that, at 11.25 m, is the MTC feed location, distinguished by 4 cold spots in Figure 4a corresponding to the 4 feed locations. The HO takes longer to evaporate in this system due to inadequate temperatures near the MTC injection, as 500 °C conditions only exist in abundance 1-2 m above. As a result, evaporation is slower, as shown in Figures 2 and 3. Particle temperature decreases in fluid cold spot locations as well, and the colder zones of Figures 4a-d are all consistent with one another.
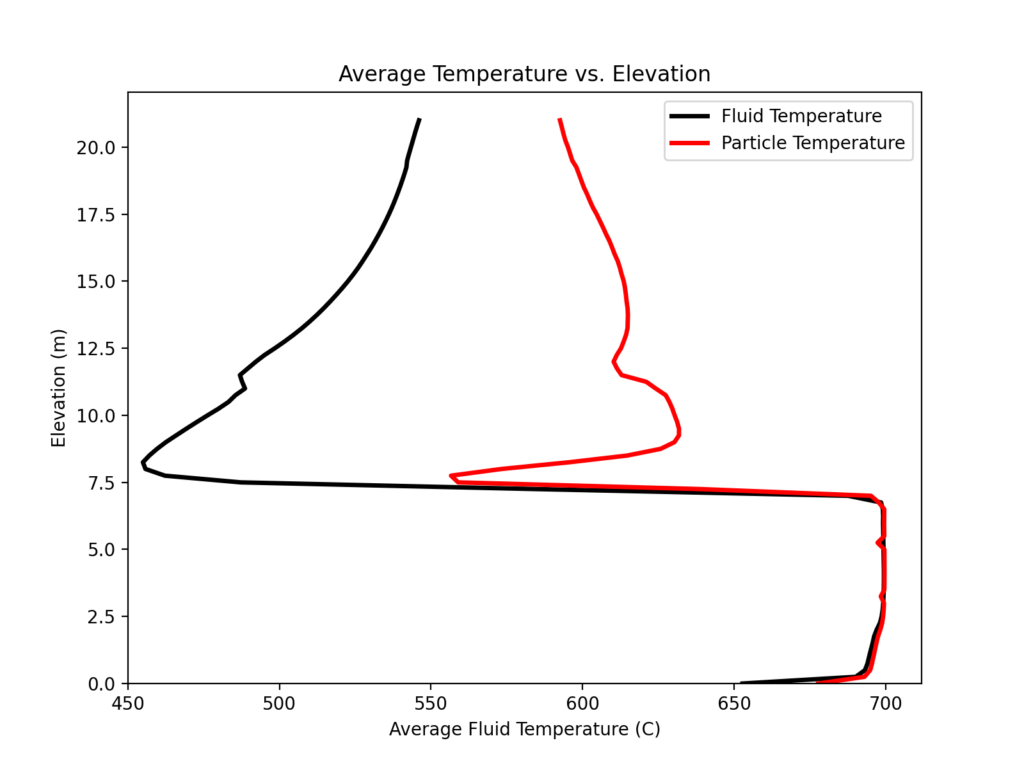
Figure 5: Time-Averaged Fluid and Particle Temperature vs Riser Elevation
Figure 5 presents time-averaged fluid and particle temperatures mapped onto an Eulerian grid across several riser elevations. Consistent with the temperature contour plots in Figure 4, the fluid and particle temperatures are both around 700 °C over the first 7.5 m in elevation. Above this, LG feed and HO feed are present, and temperature is drawn from both the gas and solid catalyst to evaporate the liquid feeds. Temperatures around the LG injection are at least 450 °C, exceeding the species’ boiling-point range and ensuring complete evaporation. Above this, at 11.25 m, HO is injected, and the temperatures are below 500 °C, leading to much slower evaporation over the next 8 m.
Figure 6: Light Gasoline Olefin and Aromatic Species Mass Fractions: (6a) Discrete Olefins, (6b) Fluid Olefins, (6c) Discrete Aromatics, and (6d) Fluid Aromatics.
As the liquid droplets are fed to the riser and evaporate, the same species transitions to the gas phase and can participate in cracking reactions. Figure 6 compares the spatial distribution of two LG-range species, olefins (G_O) and aromatics (G_A), in both their discrete liquid-droplet and gas-phase forms from 10 to 80 s, showing each species’ evaporation behavior as it travels up the riser. Figure 6a shows the liquid droplet mass fraction of the G_O species, rendered as droplet clusters near the feed injection region at 7.25 m in elevation. The droplets are tightly concentrated around the injection nozzles, with mass fraction values up to 1.0 (yellow) at the droplet cores. The discrete mass fraction values largely remain the same across all animations because the droplet is losing volume and mass over time, yet the composition remains proportionally constant until the droplet completely evaporates. Figure 6b shows the corresponding gas-phase mass fraction of G_O after evaporation. The plot shows a rapid rise from low concentration near the injection point (blue, ~0–0.1) to a broad high-concentration plateau (yellow/orange, 0.5–0.7) that persists through the mid-to-upper riser, indicating that olefin evaporation is largely complete shortly after injection. Similarly, the discrete liquid droplet mass fraction of the aromatic species, G_A, is shown in Figure 6c. The droplets are similarly concentrated around the injection nozzles and disappear after a few meters. The rapid disappearance of liquid droplets agrees with the LG species evaporation profile in Figures 2 and 3, as within 4 meters, the vast majority of LG species have evaporated. Once evaporated, the G_A liquid species appears in the gas phase, as shown in Figure 6d, which shows the gas-phase mass fraction of G_A in the riser. Within the light gas species, much less aromatic gasoline is present, resulting in lower gas-phase mass fractions, but relatively complete evaporation in the system.
Figure 7: Light Gasoline Saturated Species and Heavy Oil Mass Fractions: (7a) Discrete Saturated Gasoline, (7b) Fluid Saturated Gasoline, (7c) Discrete Heavy Oil, and (7d) Fluid Heavy Oil.
The discrete and gas-phase profiles for the final gasoline species, G_S, are much like those of G_A and G_O. Figure 7a shows the discrete mass fraction of G_S, exhibiting the same rapid evaporation and disappearance from the system, while Figure 7b shows the corresponding gas-phase G_S species forming over the feed oil injection location. The final liquid species included in the FCC feed is heavy oil (HO), which evaporates more slowly than the LG species. As shown in Figures 2 and 3, the less volatile, higher-molecular-weight HO species evaporates over 9 m and exhibits unique flow profiles compared with the lighter liquids. Figure 7c shows the discrete liquid mass fraction of HO, illustrating its tendency to segregate toward the flow’s outer boundaries. The liquid droplets do not disperse as evenly across the upper portion of the riser and move more slowly up the riser walls. The corresponding gas-phase HO species shown in Figure 10d appears in clumps along the wall, as well as in more localized events. This flow profile is consistent with the HO particle-size animation in Figure 3, where droplets travel along the wall in clumps and evaporate more slowly, giving the species a chance to accrete.
Liquid droplet flow along the wall can lead to significant problems, most notably liquid accretion. Accretion in FCC risers is often attributed to poorly atomized liquid feed, which results in coalescing oil droplets that mix with catalyst along the riser walls and tend to stick. The liquid accretes on the wall before it can vaporize, building up a liquid film on hot surfaces that accelerates thermal degradation in the riser and localized coke formation. Eventually, accretion can significantly reduce the riser cross-sectional area, affecting pressure drop, hydrodynamics, and overall unit conversion and product yields.
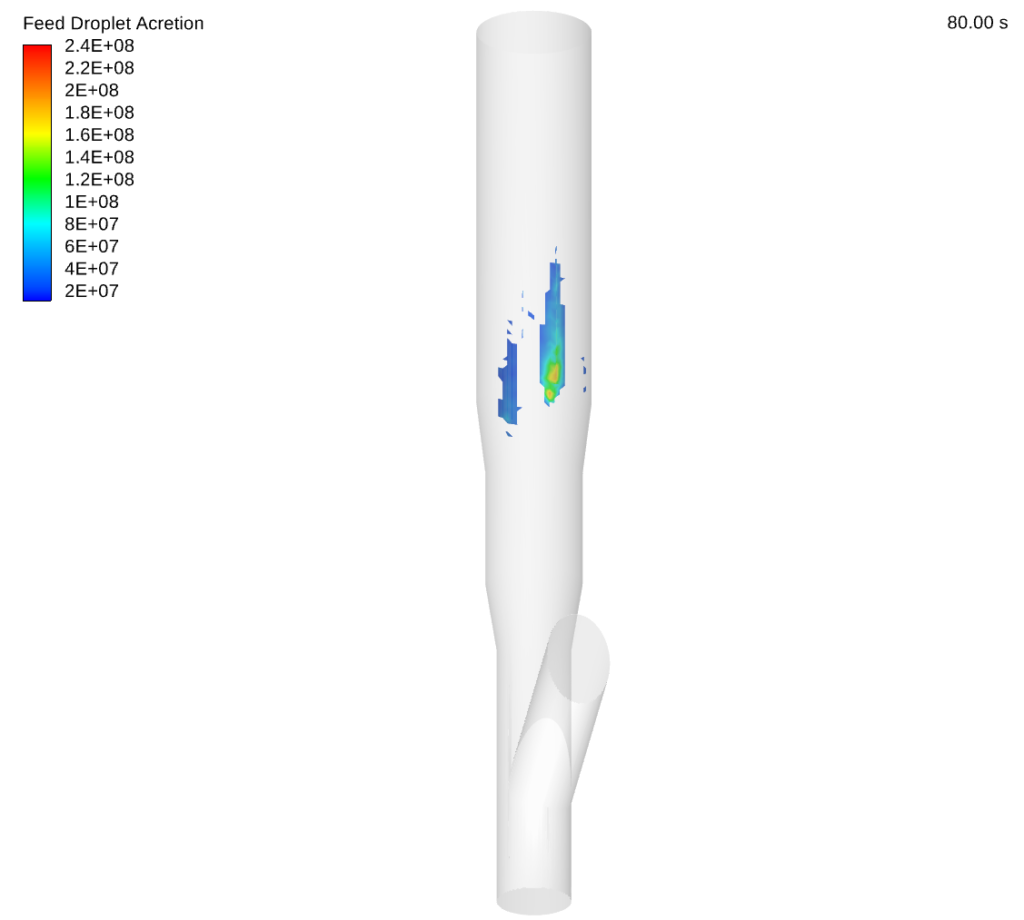
Figure 8: Heavy Oil Droplet Accretion in FCC Riser.
Accretion of liquids was modeled in Barracuda, and the resulting predictions are shown in Figure 8. The LG species dispersed and vaporized quickly, and the model predicted no droplet accretion, while HO showed significant accretion near the MTC injection location. Accreted HO manifests as concentrated, localized patches along the riser wall. These regions highlight where the heavier droplets impinge on the surface rather than vaporizing uniformly into the main upward flow. Identifying potential accretion locations is a strong use case for Barracuda to optimize injection locations and operating conditions.
Modeling Instructions
FCC Riser Setup
The user is expected to have already completed the basic Barracuda training, Barracuda Virtual Reactor New User Training (cpfd-software.com).
-
- Download the FCC Riser Feed Vaporization Support File from this link.
- Unzip the support file and place it in the working directory set up for this project.
- Open a new Barracuda session.
- From the File menu, choose Open Project. Navigate to the working directory and select FCC_Riser.prj.
-
To recreate the images and animations in Figures 3-8, use the layout (.lay) files in the provided support file. Refer to the instructions below to load them in Tecplot for Barracuda.
- In the Barracuda GUI window, navigate down to Post-Run in the project tree, and select the View Results tab.
- In the resulting Tecplot window, select File, then Open Layout, and select from your file system one of the provided 6 layout files.
This concludes the simulation setup description for the FCC Feed Vaporization Application Model.
References
Berrouk, A. S., Pornsilph, C., Bale, S. S., Du, Y., & Nandakumar, K. (2017). Simulation of a large-scale FCC riser using a combination of MP-PIC and four-lump oil-cracking kinetic models. Energy & Fuels, 31(5), 4758–4770. https://doi.org/10.1021/acs.energyfuels.6b03380
Bryden, K. (n.d.). 80 years of FCC. Grace. https://grace.com/insights/80-years-of-fcc/
Gan, J., Zhao, H., Berrouk, A. S., Yang, C., & Shan, H. (2011). Numerical simulation of hydrodynamics and cracking reactions in the feed mixing zone of a multiregime gas–solid riser reactor. Industrial & Engineering Chemistry Research, 50(20), 11511–11520. https://doi.org/10.1021/ie100232h
Meirer, F., Kalirai, S., Morris, D., Soparawalla, S., Liu, Y., Mesu, G., Andrews, J. C., & Weckhuysen, B. M. (2015). Life and death of a single catalytic cracking particle. Science Advances, 1(3), e1400199. https://doi.org/10.1126/sciadv.1400199
Shell. (n.d.). A step-change in feed nozzle design. Shell Global. https://www.shell.com/business-customers/catalysts-technologies/refinery-equipment/fcc-unit-internals/feed-nozzle-design-q-a.html